

Back in 2021 I wrote a blog on Lists and Power BI. Microsoft had just released the ability to visualise a list through the integrate tab. And at that time everything was pretty much good, except it had a fundamental issue where whilst it generated the report on top of List, that report didn't appear in the Power BI service itself. I know, I know. It kind of sounds like one of those first world problems right - and I guess to some extents it is given that the report could be created after all. But for me, who uses Lists as data sources, and wanted them in the service, in a workspace alongside other reports and then to pull then back through into the Power BI App in Teams, it was kind of a frustrating situation being that close. Today, I am probably a bigger user of the Desktop App than the service, connecting to Lists and then publishing them to the service. And this scenario probably pushed me to being more of a Desktop user than a Service user all up. But now we have the ability to export the list directly into Power BI as a dataset. This is massive. So let's go building.
Category: Power BI
Teams Real Simple with Pictures: Lookup Columns in Lists. Surfacing in Power BI.

I had an enquiry from a co-worker this week. It was as follows: they had access to two lists that they used daily. These lists were in two different teams' channels. However, they wanted to bring some of the data from one list into another to 'make their life easier'. On top of this they wanted - as a bonus - to display the data visually. However, they were not permitted to amalgamate the lists due to others using them and the business wanted them separate. So how could we solve this to make things easier? This is almost a textbook case for using lookup columns. What we need is a list relationship, where information from one list (the source list) can be used in another list (the target list). List relationships let you join information from two lists and keep it consistent while people edit and delete list items. Sound good? It is. However, there is four really important things to know with lookup columns before we get going. First, they don't currently support all column types. Whilst Single Line of Text, Date and Numbers are supported, other types such as Choice and Currency are not. Secondly, they are only supported in the same SharePoint site. In Teams land that means only if the lists are in public channels in the same team or if both lists are in the same private channel. No cross team. No cross public and private channels. Third, if you are using large lists then lookup columns may not be a solution. At that point we may be looking at something like SQL and Power Apps. But the biggest one - number four - is this. A lookup column does not automatically add values from a source list. A lookup column allows you to add values held in a source list. In other word the source list seeds values for the target - but they have to be added manually. This is an important distinction. Here is how to create a list with lookup columns to another list. And as a bonus, connect that List to Power BI to report on it
Teams Real Simple with Pictures: Power BI reports from Lists – the new way, or old? And getting them both into Teams
I don't mind putting up my hands and admitting that even though we are only halfway through 2021 this year has been particularly full on. I've already hit a few of what I like to call 'crush periods' where the totality of work, community, exams, and everything else reaches a point where you think 'how am I going to surmount this? Of course, this may be something you have experienced yourself; that point which borders of getting out of hand and the term unsustainable applies. But you know what? It's been surprising too. These periods haven't been where I would have expected or anticipated them to be given that I have a lot of experience in conclusively dealing with volume and actively managing workload. They've typically emerged out of left field and can then disappear again just as quickly. Now, it's important to state for the record that I consider this to be very much a first world problem. Given what has happened to many during Covid I am extremely lucky and privileged irrespective of how it gets since I have the luxury of a job and one which is in demand; and if I am being totally honest with you I am also a big reason for my own time poverty since I like speaking on the circuit, and writing blogs like this, and teaching, and many other things besides. The point is, in relation to a busy life it's becoming really really important to use what is within my means to economize my time. If you have been following the blog over the past several months you may have noticed: a lot of that involves the Power Platform. In my job, I work with others trying to build Power Apps for things which significantly improve existing business processes. I am personally trying to automate my way out of as many things as possible which I do manually with Power Automate. I build dashboards and reports in order to make better and faster data driven decisions. With Power Virtual Agents, I am loading a bot with Q&A so others don't need to come and ask me about it again and again and again. So as a big advocate of Microsoft Lists, a subject which I've written and spoken about often in the past - and will do once again at the European Collaboration Summit in November - it's been really awesome that Power BI reports can be built on top of Lists. Let's have a look at this, and then let's see if we can get this into the Team
Microsoft Power Platform Fundamentals (PL-900) Exam Prep Guide

Analyse, Act and Automate. Buzzwords these may be - but the importance of the Power Platform is real. About a year ago, I was sitting in a meeting in Dublin discussing Microsoft 365 with a partner whose business was built upon Power Apps. As much as I was impressed with the app on the IPad they'd recently developed after their receptionist left, it was the dawning on how they viewed Microsoft 365 through the prism of applications. It's very easy to narrate a story on Microsoft 365 around Security, Teamwork or the modernization of devices (three narratives Microsoft typically use today). But I had never considered doing that based upon apps. Never even entered my head.
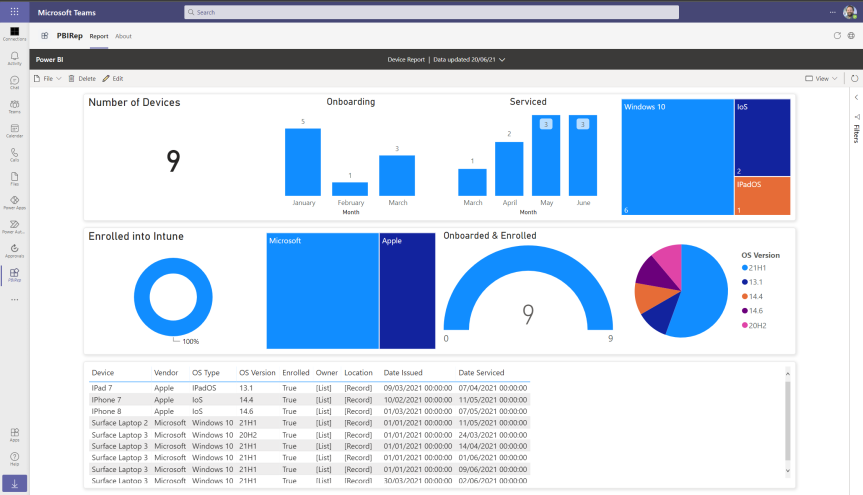
Teams Real Simple with Pictures – Using Power BI Dashboards for insights and data driven decisions within the Team
An increasing amount of our working lives are spent in Team meetings. The biggest issue of mine - at least with the meetings I attend on a regular basis - is that they still often lack insights from data, lack open team discussions based upon and challenging these insights and data driven decision making. All too frequently meetings tend to descend into wild conjecture or arguments based on emotion without anything to back that up. Even worse, not all members of the team always have access to such data to be able to counter arguments based upon data hoarded by other individuals.
